
The Rise of the BIDs
Business Improvement Districts (BIDs) first arrived in this country twenty years ago. Since the establishment of the aptly named Kingston First in 2004, 340 further BIDs have been set up across all parts of the UK. By raising money through levy payments collected from local businesses, BIDs have invested in excess of £1billion in the regeneration and placemaking of a wide range of urban and rural communities.[1]
Of the 341 BIDs in the UK, more than one in five (76 or 22%) are found in the capital. The predominance of London’s BIDs is even more marked in terms of their annual income with 40%, or close to £62m of the £155m raised nationally by BIDs each year, reinvested in the capital.
Figure 1: Data on Business Improvement Districts by nation and region (British BIDs 2024)
| Region or Country | Number of BIDs | Hereditaments (est.) | Levy Income (est.) |
| East Midlands | 10 | 5,660 | £4,703,355 |
| East of England | 29 | 11,435 | £9,799,541 |
| Greater London (% of UK totals) | 76 (22%) | 23,876 (18%) | £61,634,153 (40%) |
| Ireland | 5 | 7,013 | £5,211,213 |
| North East England | 6 | 2,808 | £3,408,678 |
| North West England | 35 | 11,624 | £11,437,101 |
| Northern Ireland | 8 | 3,088 | £2,993,228 |
| Scotland | 35 | 11,527 | £6,337,082 |
| South East England | 43 | 18,017 | £15,522,957 |
| South West England | 31 | 13,419 | £10,092,550 |
| Wales | 13 | 3,796 | £2,927,024 |
| West Midlands | 32 | 13,359 | £12,008,114 |
| Yorkshire and the Humber | 18 | 10,215 | £8,855,022 |
| Grand Total | 341[2] | 135,837 | £154,930,018 |
According to British BIDs, over the past 20 years there have been 947 ballots, of which only 93 (9.8% or fewer than one in ten) have been unsuccessful. Only nineteen BIDs have either ceased mid-term, or not gone to a further ballot.[3] These figures appear to be powerful endorsements and indicators of success; they also suggest that once a BID is established in a place, it is more than likely to become a permanent feature of that locality’s civic infrastructure.
The heightened scrutiny of BIDs
A cornerstone of the statutory regulation of BIDs is the requirement to seek a renewed mandate from their levy payers every five years. Perhaps the most telling measure of a BID’s performance and perceived effectiveness are the results of the quinquennial ballot and three key metrics: the % turnout; the % of votes in favour of the BID by overall number and the % in favour by Rateable Value. BID executives and their boards aim to see improvements across each of these measures at each successive ballot.
Yet, in spite of their growing presence and longevity across UK towns and cities and in most London boroughs, the socio-economic impact of BIDs’ activities remains largely unquantified and unchallenged.[4] Their proliferation, increasing size and reach is bringing into question the adequacy of the original regulations which place the following minimal requirements on BID boards to report back to their levy payers[5]:
“The local authority may opt to send the levy bill out as part of the business rate bill or as a separate bill. The local authority is also required to issue an annual billing leaflet with the levy bills and this should include the previous year’s financial summary and the forecast for the forthcoming year as per Schedule 4 to the BID Regulations, paragraph 3 (2).”[6]
There are compelling reasons why BIDs, both individually and collectively, as increasingly prominent contributors to local placemaking, need to be better at evidencing their impact. And, with regional and national elections this year, BIDs will want to seize the opportunity to demonstrate to potentially new political masters the significance and value of what they do.
An organisation’s impact on community development and place-making is often measured in terms of its contribution to ‘social value.’ It is a concept which has been defined in multiple different ways and a concomitant number of methodologies and measurement tools are now available, spawning a veritable social value industry:
- Frameworks such as TOMs[7] or HACT[8] offer pre-defined outcomes and associated measures
- Social Value UK advocates developing bespoke, well-defined outcomes[9]
- ARUP’s UK social value white paper identifies seven parameters of outcome categories based on improvements in quality of life.
Guiding principles
Approaching impact measurement and reporting through a social value lens may seem suitable for BIDs particularly those over a certain size.[10] However, there are some important caveats, or guiding principles, to consider:
- Proportionality: BIDs are not public bodies. Retaining their unique selling point (USP) for organisational agility and their responsiveness to levy payers invariably requires BIDs to resist bureaucratic processes and red tape. The adoption of any measurement or evaluation framework needs to be proportionate to a BID’s size and capacity.
- Additionality: Part of any BID’s USP is that its activity and investment in placemaking should be in addition to already existing levels of public services in the area. Measuring a BID’s added value is only possible if there is first a quantifiable and accurate baseline in place.
- Attribution: identifying outcomes or impact which can be attributable to the BID in places which are complex, multi-stakeholder environments, is challenging. This should focus a BID’s measurement and reporting on a few key activities which can clearly be traced back, and where necessary apportioned, to the BID itself.
- Scope: BIDs tend to undertake a wide array of activities which makes distilling these into a concise impact assessment or single return on investment ratio difficult, if not impossible.
- Realism: quantitative measures need to avoid exaggeration, or overclaiming which some BIDs, by their very nature as competitive place promoters, may be prone to doing.[11]
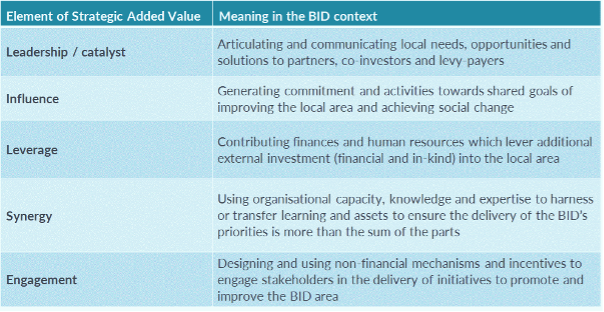
Taking these contextual factors into consideration, Rocket Science’s recent assessment of Central District Alliance recommended the BID’s repurposing the Strategic Added Value (SAV) framework. This combines a qualitative and quantitative assessment of an organisation’s impact based on five specific elements – leadership; influence; leverage; synergy and engagement (see figure below). Strategic Added Value was previously used to define and analyse the additional contributions of the Regional Development Agencies (RDAs) to place-making, over and above their programme and project spend. It has particular uses for place-based organisations like RDAs and, at a more local level, for BIDs which operate in multi-stakeholder environments, across a wide range of issues and policy areas, and where the direct attribution for measurable returns on investment can be problematic.
Figure 2: The Strategic Added Value Framework
Conclusions and Recommendations
Business Improvement Districts have become increasingly good at using data and infographics in order to report back to levy payers and stakeholders, going over and beyond the minimum requirements of the statutory BID regulations. However, the data they use tends to focus on inputs and activities; BIDs are not required to evaluate their impact, or measure value for money, and rarely do so unless they are asked to by their board. In such circumstances, it is easy to become complacent. For some, the fact that a BID is voted in is sufficient proof that they are valued.
This blog has argued that as BIDs become increasingly prominent, influential and, arguably, permanent in localities’ placemaking, the need for ways of assessing and scrutinising their impact and value also increases. At the same time, pressures on BID teams to ensure management costs remain efficient mean that any processes of impact assessment and project evaluation need to be proportionate; the outcomes both measurable and clearly attributable.
In order that this does not become burdensome and unnecessarily complicated, BIDs should concentrate on a relatively small number of priority outcomes which can readily be measured and are attributable to the BID. Narrowing the scope of the BID’s impact assessment to a small set of outcomes allows for the collection of more and good quality evidence (rather than having a larger number of less robust performance measures).
We recommend a series of practical measures (“six to fix”) which would enable BIDs better to measure and report on their contribution and social value to placemaking in an area:
- An annual survey of the BID’s levy payers and other key stakeholders, using repeat questions will allow for longitudinal perception analysis; we recommend embedding 5 annually repeated Likert-scale questions linked to clear definitions and examples of the BID’s Strategic Added Value.
- BIDs have access to a range of increasingly sophisticated data sources of local economic, transport and demographic data, yet there is a disconnection between many of these which are based on local government boundaries and nomenclature and the work of a BID. BIDs in London should (re)prioritise the most useful datasets and bring them together in an updateable dashboard format which provides an overview of the area (eg transport data, air quality, footfall counters) and is more clearly aligned with KPIs chosen to measure the BID’s most significant projects’ impacts.
- There is scope to incorporate the language of social impact and strategic added value more into the fabric of BID organisations. By becoming a part of the BID lexicon, the five elements of the SAV framework can infuse the organisation’s culture. BIDs tend to have a continual pipeline of projects; relating these to the SAV framework will enable a BID more transparently to report back on their value and impact to its varied stakeholders.
- Assessments of public perception should be embedded into a BID’s work, especially on public realm and place-making projects. Gathering people’s views of an area before and after an intervention will collect useful insight on local needs and measure the perceived difference made by a project.
- Set aside a budget of 2-3% of the BID’s annual budget/programme spend in order to enhance the monitoring, measurement and reporting of impact (concentrating on 5-6 most significant projects as identified in the BID’s Business Plan). Where appropriate, commission independent annual assessments of these and BID’s overall impact/ strategic added value.
- Appoint a Board lead for impact measurement and reporting on the BID’s added value.
John Griffiths and Alasdair Crookes
[1] Business Improvement Districts celebrate 20 years and £1billion invested in UK towns and cities – The BID Foundation (retrieved 9th February 2024)
[2] More than 60 further BIDs are currently in development.
[3] Review of Business Improvement Districts 2023 – Report from British BIDs, the Association of Town and City Management, the Institute of Place Management and The BID Foundation; for the Department of Levelling Up, Housing and Communities, September 2023
[4] The last detailed study of BIDs in London was commissioned by the Mayor of London in 2016.
[5] The Department for Levelling Up Housing and Communities recently announced it was setting up a BID Innovation Forum to consult on how the model could be improved
[6] BIDs Technical Guidance, March 2015, pp 11-12 – billing leaflet requirements (Retrieved 1st February 2024).
[7] https://socialvalueportal.com/solutions/national-toms/
[8] https://hact.org.uk/tools-and-services/uk-social-value-bank/
[9] https://socialvalueuk.org/principle-2-understand-what-changes/
[10] BID practitioners whom we consulted suggested this would be most appropriate for BIDs with levy incomes of upwards of £1m pa
[11] https://socialvalueuk.org/principle-5-do-not-overclaim/